Easter 2018 vs Easter 2019. Which regions and sectors came out first?
Which year ranks first in card transactions? Which were the top Greek regions in turnover during the Easter period and which sectors performed better in 2019 compared to 2018?
Many discussions take place every year about how much Greeks spent on the Easter table or on their excursions to the countryside, what was the turnover of businesses, which sectors performed well and which didn’t, and many more things.
Businesses await for the Easter period eagerly in order to increase their sales and turnover, following a quiet period before Easter.
Are you curious to find out what happened this year and how businesses performed compared to last year? We collected, processed and organized data from thousands of transactions* and are presenting them here!
Before we get started, here is an example outlining the calculation of differences, so that you can read the results more easily.
Suppose that a business had a turnover of 5 euro for 10 days prior to the Easter period. For the same amount of days during the Easter period, the turnover is 10 euro. I.e. it has had an increase of 100%. The following year, its turnovers are 9 and 11 euro for the 2 respective periods. I.e. it had a 22.2% increase in its turnover.
However, when comparing the pre-Easter and Easter periods of 2018 and 2019, the turnover difference in our example is -77.8% (22.2% – 100%).
The business in this example may have increased its turnover compared to the previous year, however, the increase in its turnover due to the festive season is smaller than that of the previous year.
Let’s start with the results per commercial activity!
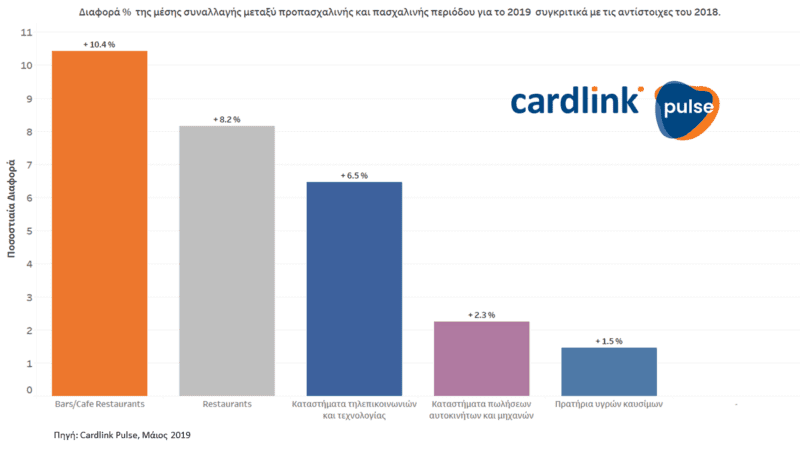
- Which are the 5commercial activities with the largest percentage increase in terms of average transaction between the pre-Easter and Easter periods for 2019 compared to 2018?
The champions are cafés/bars (+10.4%/€14.8*). Next are restaurants (+8.2%/€33.4*), telecommunications and technology stores (+6.5%/€34.4*), car and motorcycle sales stores (+2.3%/€113.9*) and petrol stations (+1.5%/€40.3).
*Average sector transaction during Easter 2019
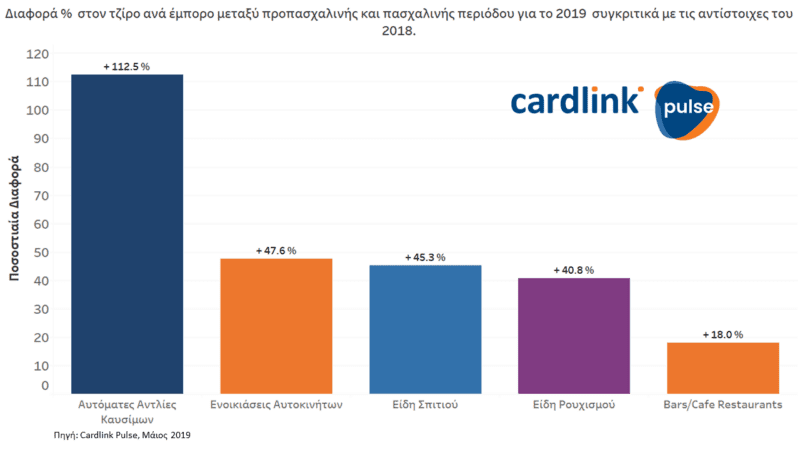
- Let’s see now the 5 commercial activities with the largest percentage increase in turnover per merchant between the pre-Easter and Easter periods for 2019 compared to 2018. First come the self service petrol stations (+112.5%) and then car rentals (+47.6%), stores with household products (+45.3%), clothing shops (+40.8%) and cafés/bars/restaurants (+18%).
Now, let’s looks at what happened per prefecture and district!
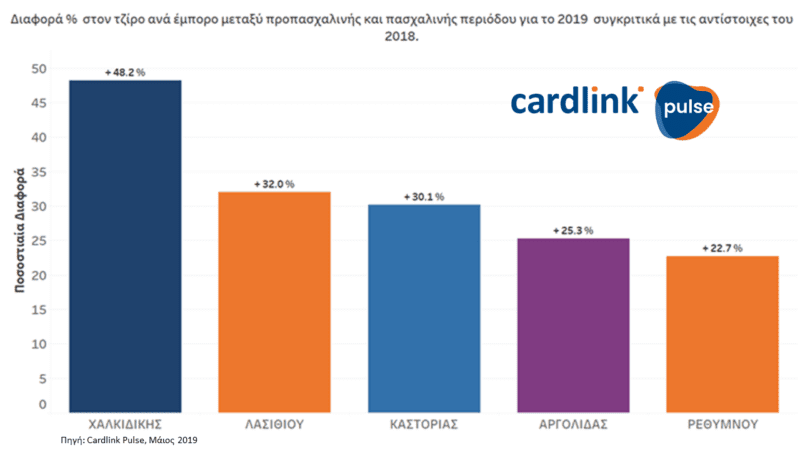
- The 5 prefectures with the largest percentage increase in turnover per merchant between the pre-Easter and Easter periods for 2019 compared to 2018, i.e. the prefectures that experienced the largest difference this festive period were: Chalkidiki(+48.2 %), Lasithi (+32%), Kastoria (+30.1%), Argolida (+25.3%) and Rethymno (+22.7%).
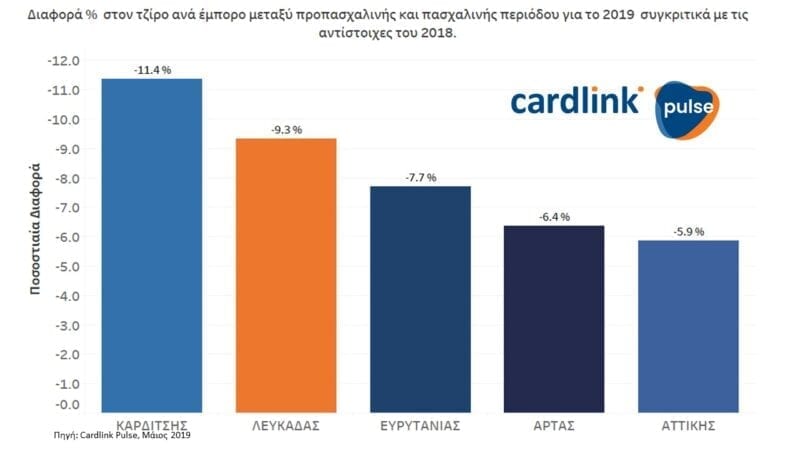
On the contrary, the 5 prefectures that had the largest negative differences in turnover compared to the respective period last year are Attica (-5.9%), Arta (-6.4%), Evritania (-7.7%), Lefkada (-9.3%) and Karditsa (-11.4%).
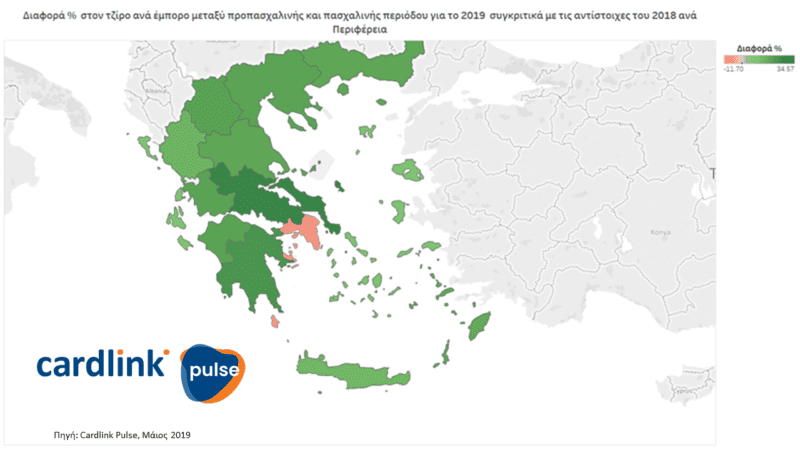
In terms of districts, we can see in the map that follows that in the district of Attica the turnover increase decreased compared to 2018 between the festive and non-festive periods. On the contrary, the increase was reinforced in Continental Greece and the Peloponnese.
Both last year and this year, the day on which most transactions were carried out during the Easter period was Holy Thursday!
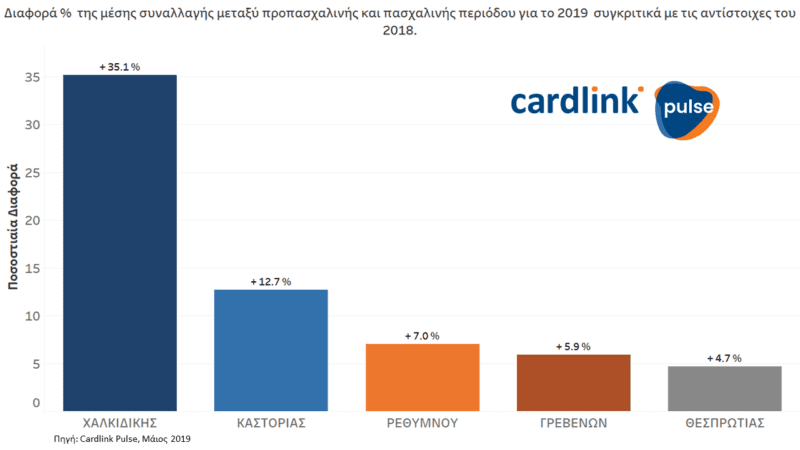
- Respectively, the 5 prefectures with the largest percentage increase in terms of average transaction between the pre-Easter and Easter periods for 2019 compared to 2018 were the prefectures of Chalkidiki (35.1%), Kastoria (12.7%), Rethymno (7%), Grevena (5.9%) and Thesprotia (+4.7%).
On the contrary, the difference in percentage increase in terms of average transaction for these two periods compared to last year is negative for the prefectures of Zakynthos (-7%), Cephalonia (-8%), the Cyclades (-8.2%), Karditsa (-9%) and Evritania (-9.6%)..
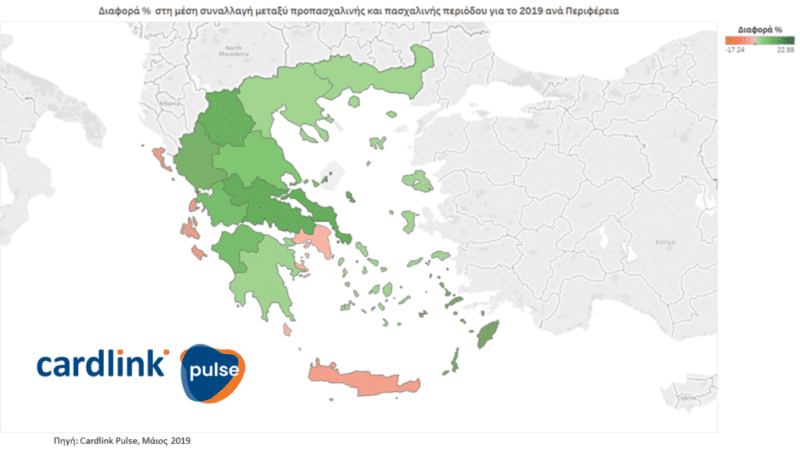
In terms of districts, the districts of Attica, Crete and the Ionian Islands experienced a decrease of the increase in terms of average transaction compared to 2018 between the festive and non-festive periods. On the contrary, the increase was reinforced in Continental Greece, Western Macedonia, the Peloponnese, the Dodecanese and Epirus.
- Finally, we will take a look at the turnover differences per merchant between the pre-Easter and Easter periods, which remain positive for all prefectures this year, with the 5 that show the highest turnover increase being: Argolida (+72.8%), Trikala (+60.9%), Kastoria (+60.5%), Grevena (+59.9%) and Messinia (+59.6%), thus revitalising the market, and they are summarised by district as shown in the map below.
Therefore, for this year’s Easter, the largest turnover increase can be seen in Continental Greece, while the district of Western Macedonia follows. The lowest increases can be seen in the islands of the North Aegean Sea, the South Aegean Sea and the Ionian Sea, Crete and Attica.